


 TRAINING


 PAPERS
 REFERENCES
 GET IN TOUCH

|

|
 Downloads
|
 Prices
|
 Videos
|


|
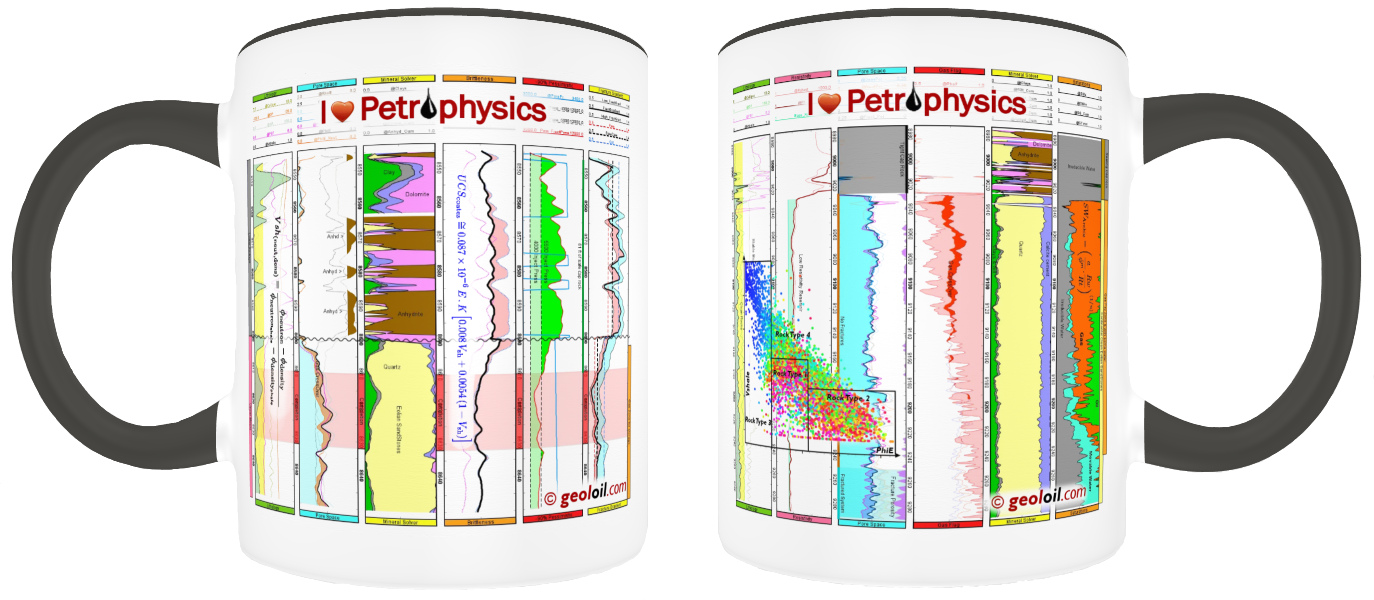
"I love Petrophysics" |
GeolOil - How to calculate Shale Volume from Neutron-Density porosity difference
Estimating the Shale Volume (VSHALE) from Gamma Ray (GR), remains the most popular standard technique to compute an initial curve of rock shaliness. However, the approach is far from perfect due to several criticisms:
- How reliable are the VSH estimates from GR if the rock matrix itself contains some even slightly radioactive minerals like feldspars?. What about if there are Kaolinite clay minerals with a low Gamma signal response?. If you are luckily enough, you may have a modern spectral Gamma Ray suite to apply a careful computation, better than using traditional total Gamma Ray.
- If the first guess linear Gamma Ray Index produces an overestimation of the VSH (very common), you may reduce it using well known corrections VSH=f(IGR), like Larionov for tertiary rocks or young rocks, Larionov for older rocks, or even Steiber and Clavier. But what is the best correction for the actual reservoir?
- What would happen if an increase in clay content is related to an increase in rock bulk density?
- To apply a Vshale estimate from GR, you must be sure that you really have at least one point of a clean sand, and a real shale rock in the formation under study. But what would happen if just the whole clastic formation is shaly?. Then you can not simply pick a value of GR_clean to input into the linear GR index equation. Likewise, are you sure that you have a real shale rock body in the formation?
If modern logs are available, it is good idea to compare several Shale Volume estimates. The Neutron Porosity to Density Porosity difference is perhaps after the GR, the next preferred method to calculate the Volume of Shale.
Provided that the reservoir under study does not contain natural gas, shaly sands will show higher neutron porosity values than density porosity values. Conversely, if neutron porosity is smaller than density porosity (called gas crossover), it is a very strong indication of gas presence.
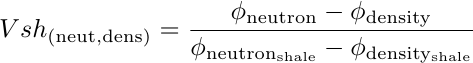
If there is no gas present in the formation, the neutron porosity to density porosity difference tends to have a linear response with rock's clay content. This is because the neutron porosity tool is very sensible to the high hydrogen index of clays, while the bulk density tool does not. Even better, the difference does not depend upon Gamma Ray, so it provides a GR independent estimator:
Clay minerals like kaolinite, chlorite, illite, and montmorillonite, have a high hydrogen index. However, the minerals quartz & feldspar, calcite, and dolomite, present in clean sandstones, limestones, and dolostone matrices, don't. The table below highlights clay minerals properties. Notice how their chemical formulas contain hydrogen atoms, while quartz, feldspar, calcite, and dolomite, don't.
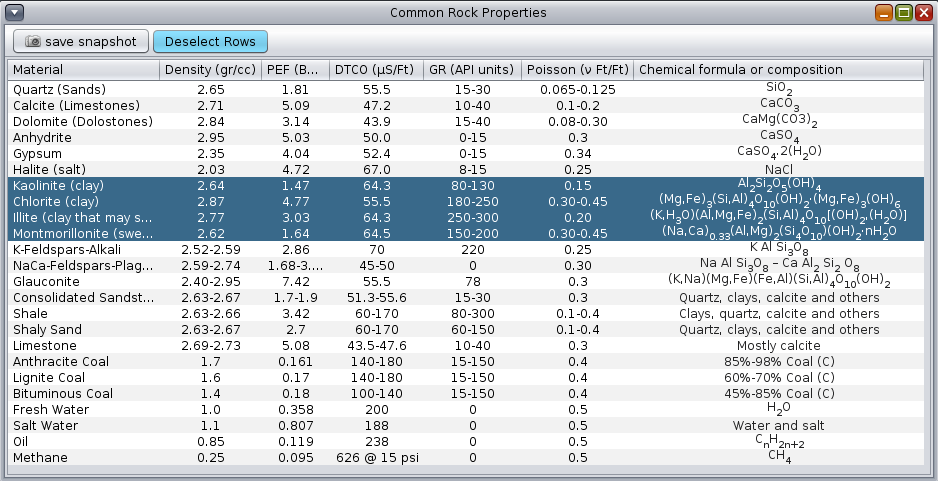
Typical rock mineral petrophysical properties. Compare H atoms content in the clay formulas.
Since the neutron porosity tool signal depends strongly upon sandstone, limestone, or dolostone matrix lithology (the bulk density tool doesn't), it must be converted or corrected to the actual reservoir rock matrix column before applying the difference equation between neutron porosity and density porosity.
The GeolOil Functions module provides the necessary conversions between matrix lithologies. In most of the cases, the logging company delivers a neutron porosity curve calibrated to a 100% pure limestone matrix lab sample (regardless of the actual reservoir lithology). Then, if the actual reservoir consists of sandstones, its signal must be corrected or converted to a sandstone lithology. If the actual reservoir column is complex and have a variable matrix lithology or succession, GeolOil will gladly take a target matrix density lithology curve (instead of a constant) for the conversion.
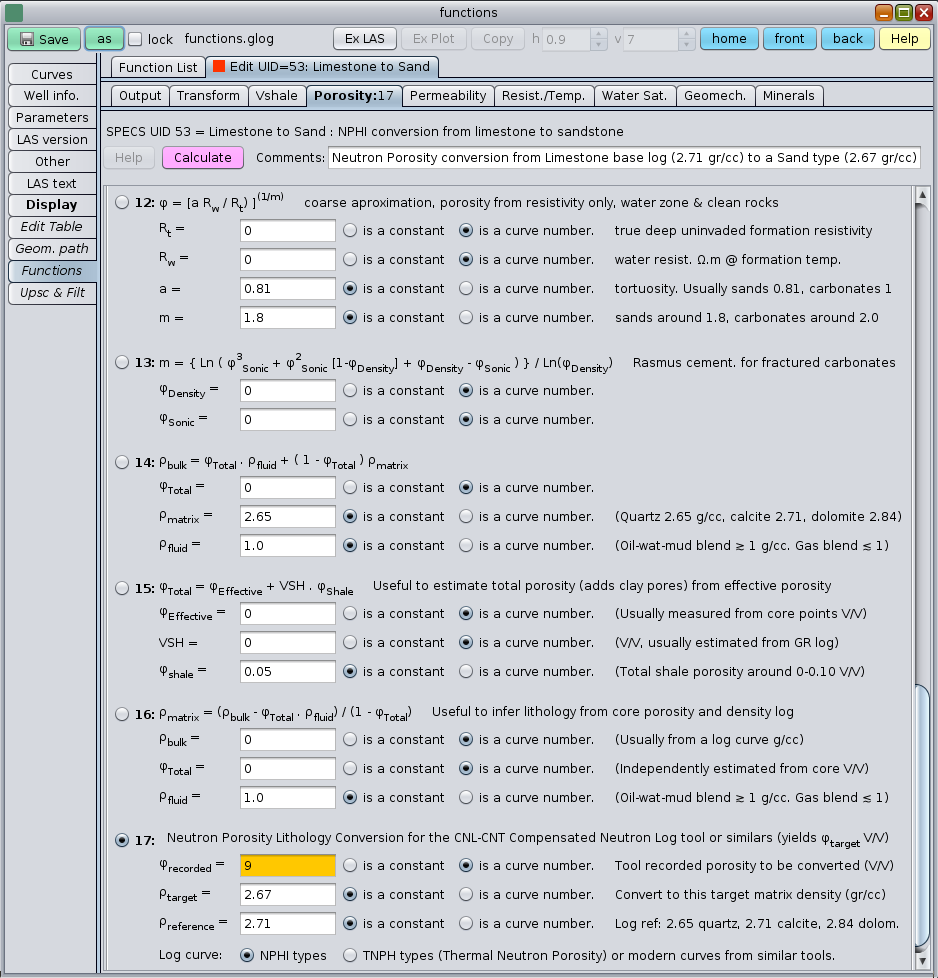
The figure shows at its bottom the functions panel to convert NPHI neutron porosity from limestone to some sandstone matrix
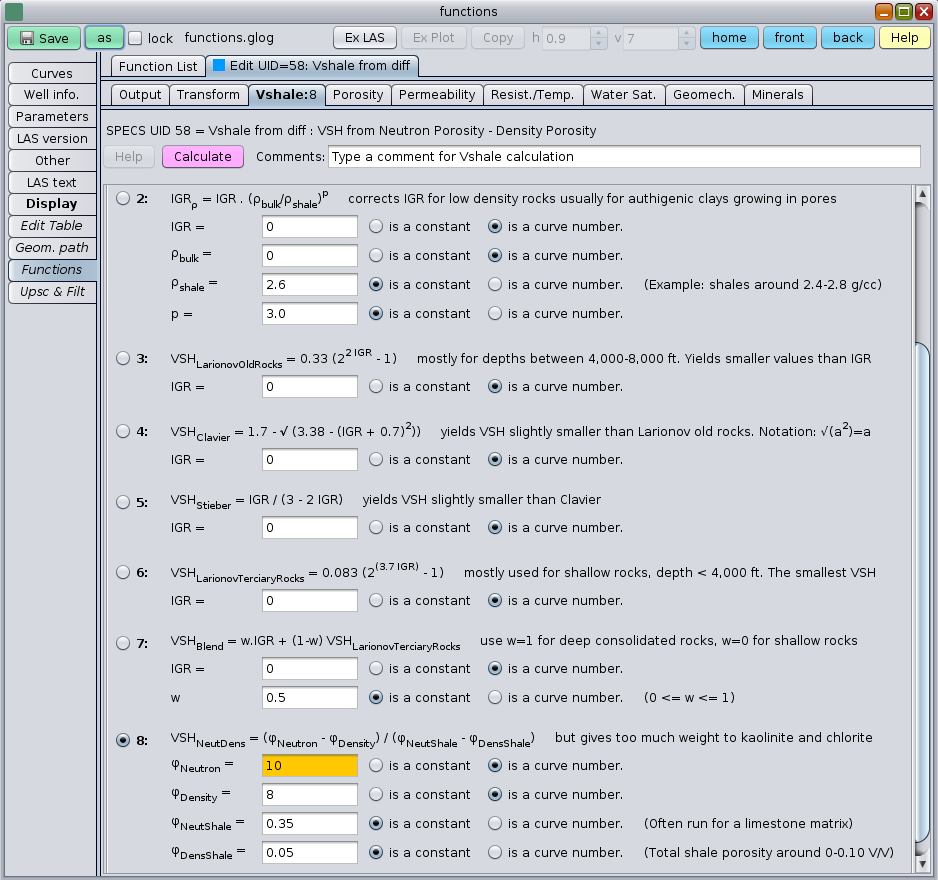
The GeolOil VSH Functions Panel to compute Shale Volume
The log curves plotted below show the result of a new generated .LAS file:
-
Track 1Shows basic general and lithology information: The Gamma Ray curve GRGC (a rule of thumb of 65 API units threshold value was used to contrast in yellow and green, sandstones and shaly sandstones trends). The photoelectric factor PDPE, and the caliper CLDC. -
Track 2Plots resistivity. A 17 Ohm.m threshold cutoff pink filling was used just as a preliminary guide to explore possible pay sand zones. -
Track 3Highlights in light green the difference between neutron porosity and density porosity. The area highlighted itself is an excellent visual indicator of clay content. The thicker, the more volume of shale. The thinner, the cleaner rock. Furthermore, if there would be gas presence, the neutron to density crossing would happen clearly negative in the reverse direction. A bonus. -
Track 4Compares three classic estimates for Vshale: The solid and thick green curve represents the standard linear Gamma Ray Index. It seems to have a trend to over-estimate VSH in many cases. The dotted light green curve shows the Larionov young-shallow rocks VSH correction from IndexGR curve. It seems to sub-estimate the shale volume. The solid red curve plots the VSH estimate using the neutron porosity to density porosity difference method. It has a balanced and believable behaviour of rock shaliness, showing higher resolution details than the GR log.
The neutron to density difference method usually does not need corrections for matrix radioactivity or VSH over-estimation. It is indeed an excellent VSH estimator that should be computed any time the neutron porosity and bulk density curves are available. However, if the caliper shows a unstable borehole, density porosity wash-outs might show and the results will be severely affected or unusable.
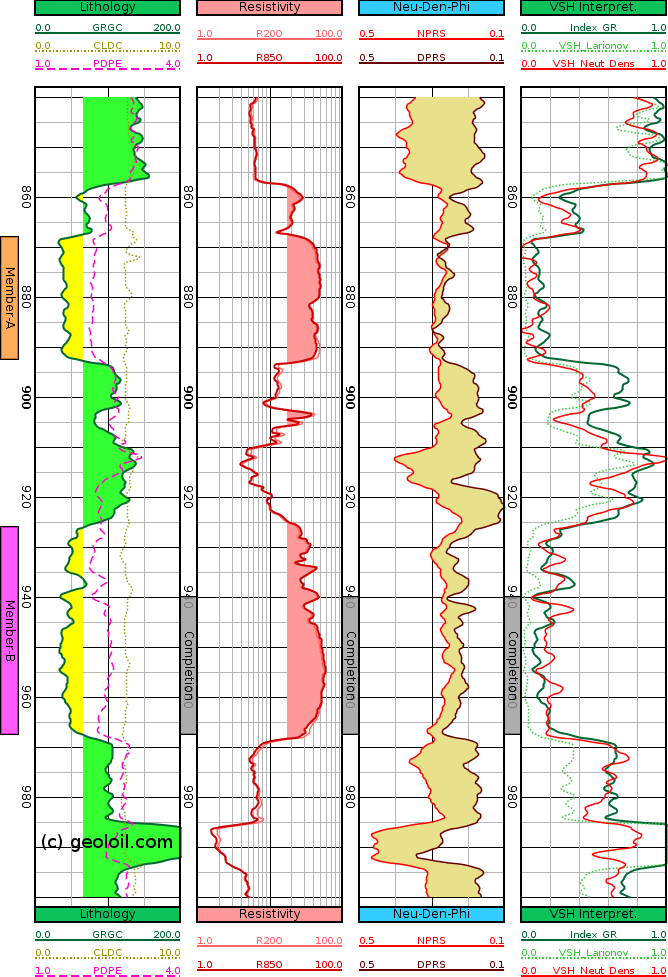
Comparison of VSH computed as Linear GR index, Larionov and Neutron-Density difference.

|
Related articles:
|
|
| |


|
|
|
© 2012-2026 GeolOil LLC. Please link or refer us under Creative Commons License CC-by-ND |