


 TRAINING


 PAPERS
 REFERENCES
 GET IN TOUCH

|

|
 Downloads
|
 Prices
|
 Videos
|


GeolOil - Advanced Petrophysics Scripting Examples
"The scripting is native to the GeolOil program. It is very easy to use, and you can build and save your own workflows
so you can use them again."
Robert Colpitts. Senior Geologist. JRC. Texas, USA.∎
"I use GeolOil for Well Integrity analysis, using caliper logs as input"
Enis Aliko. Senior Drilling Engineer. Wellynx. Italy.∎
The articles of Basic log Scripting and Scripting Reference, cover the fundamentals on how to use GeolOil GLS scripting for most classic quick petrophysical tasks. Here we present some work-around recipe ideas to solve more complex needs:
1. Defining a stepwise, variable curve per zone constant value:
GeolOil GLS Scripting allows to compute stepwise, variable curves with constant values per zone easily,
with few lines of code.
This is a common need in petrophysical interpretation. For instance, different zones can have different
equivalent NaCl
formation water salinities, and also different parameters a, m, and n, for different clastic or carbonates
zones.
Since GeolOil uses the Sigil "%" to read values from the LAS and GLOG sections of Parameter, Tops,
and Well info, the next five images show how to create a stepwise curve for salinity for a reservoir with three different
stratigraphic zones and salinities:
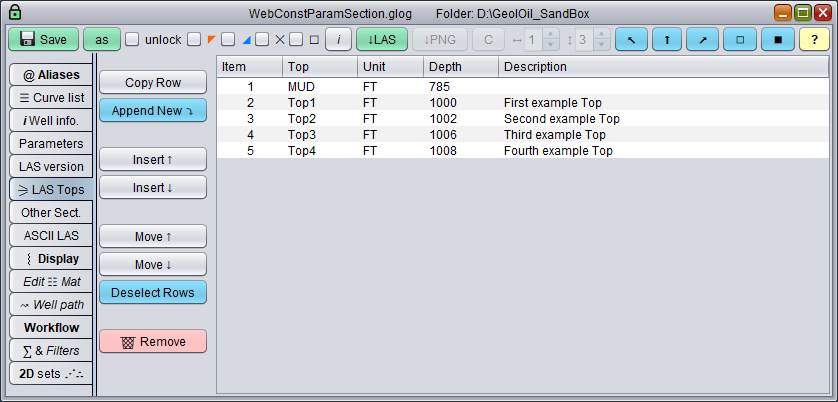
Four tops for three zones
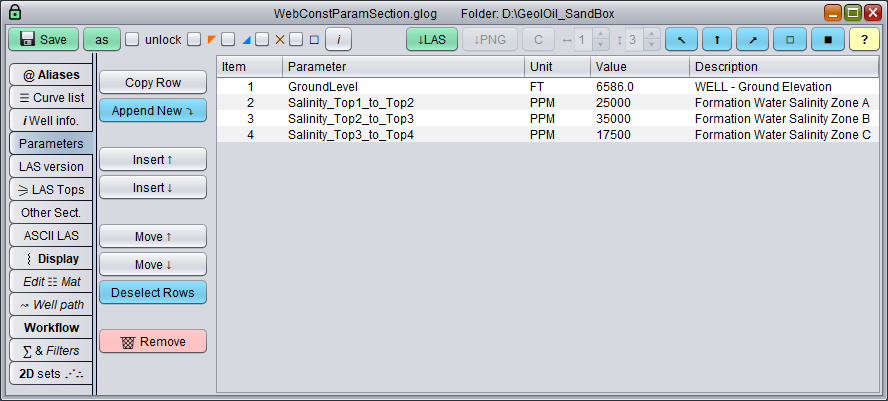
Three stratigraphic zones with three different salinities
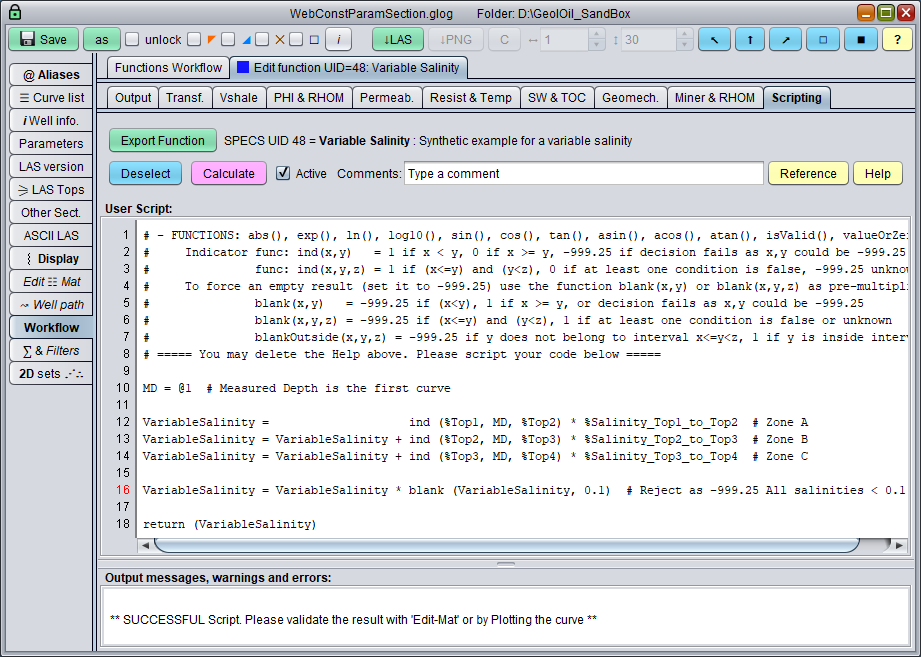
GeolOil Script to produce a stepwise variable salinity curve
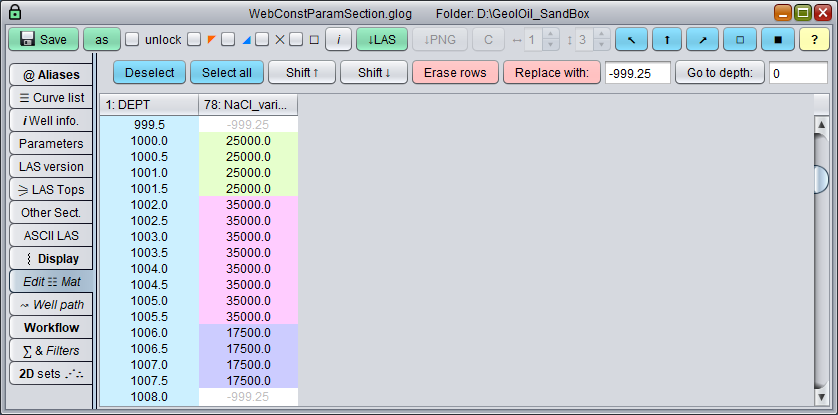
Table result values for computed stepwise variable salinity curve
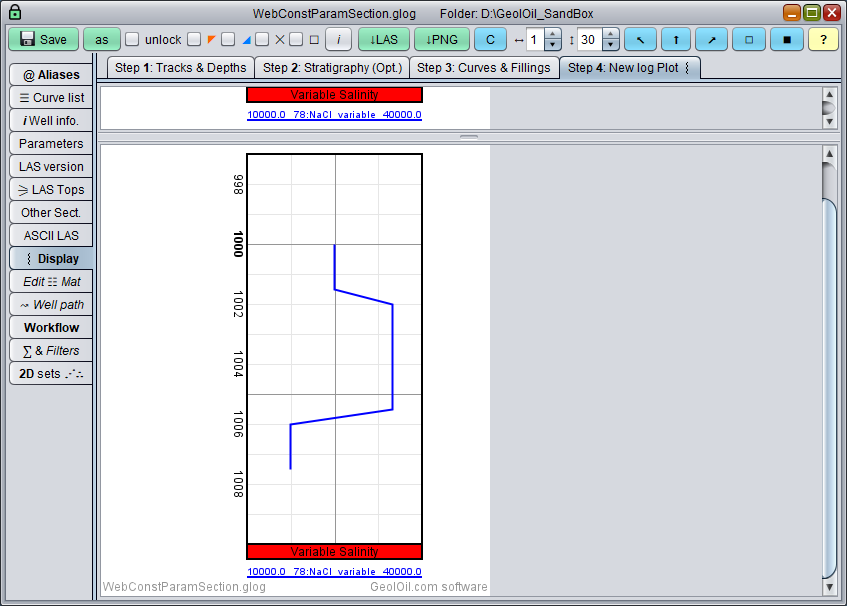
Log plot for computed stepwise variable salinity curve
2. Well log stretch script that expands or compresses depth space correlations:
GeolOil GLS Scripting provides out of the box, built-in functionality to perform not only constant or variable depth shifting,
but also irregular proportional arbitrarily depth deformations. You can stretch a curve that needs to be expanded or contracted to
follow a user defined set of marker correlations.
The recipe script below, shows how to stretch a clay curve to match three deformation correlation pairs:
original depth — target depth. This is useful for instance, to depth correct curves from different runs and vendors.
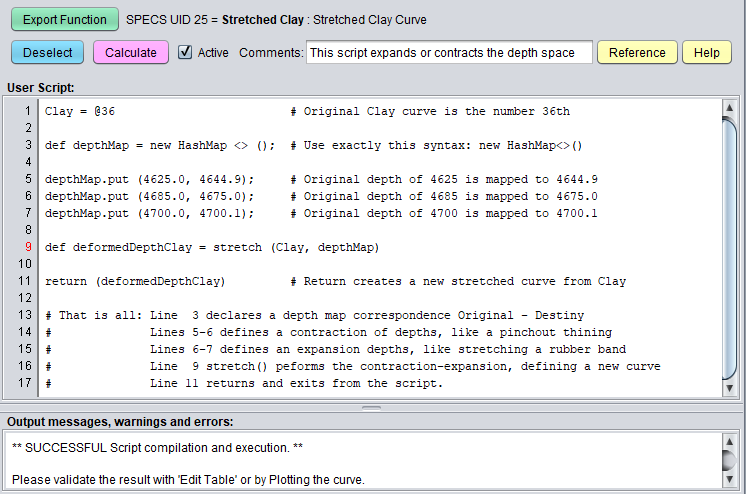
GeolOil GLS Script to stretch depth well log correlation
A run of the script code produces the following well log plot:
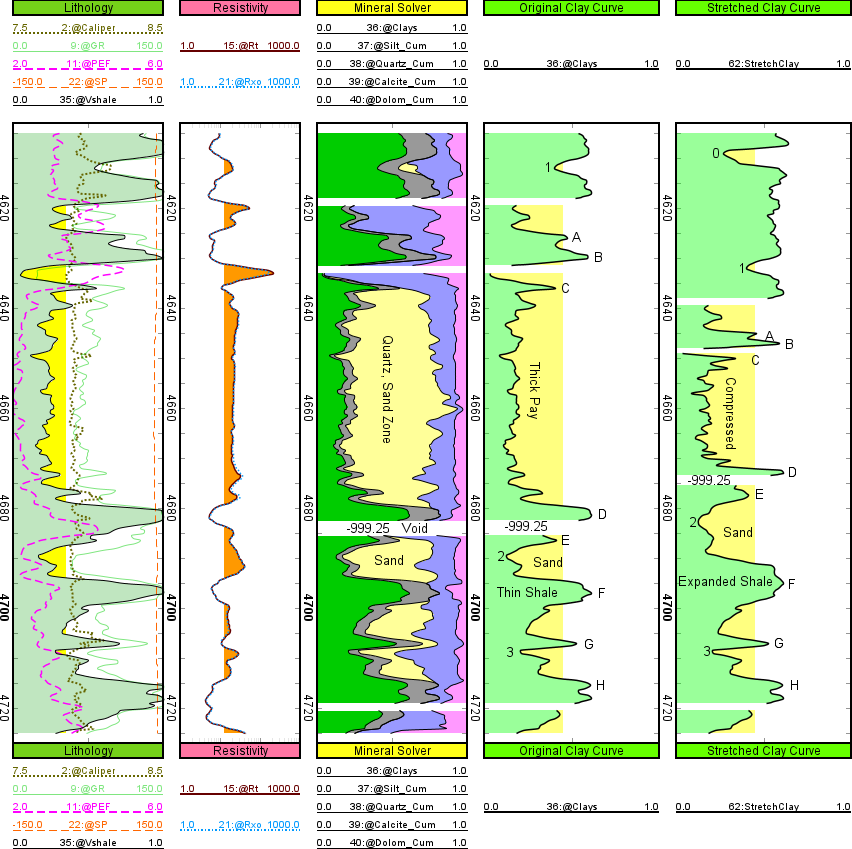
GeolOil well log plot that stretches depths to follow top correlations
3. Iterations, convergence, and flow loop control commands: How to use nested, java style
while(){} and for(;;){} commands.
To handle iterations, the full Depth Loop Mode, instead of the Stream Scripting Mode has to be used.
Why? Because of the need to use point 0D scalar comparison inequalities (like 3.7 > 2.3),
not the 1D curve f(z) objects of the stream mode.
The following pedagogical numerical script example, illustrates how to estimate the square root of a number using the
Babylonian method
of iteration convergence, and how to implement a single nested counter inside a depth zone:
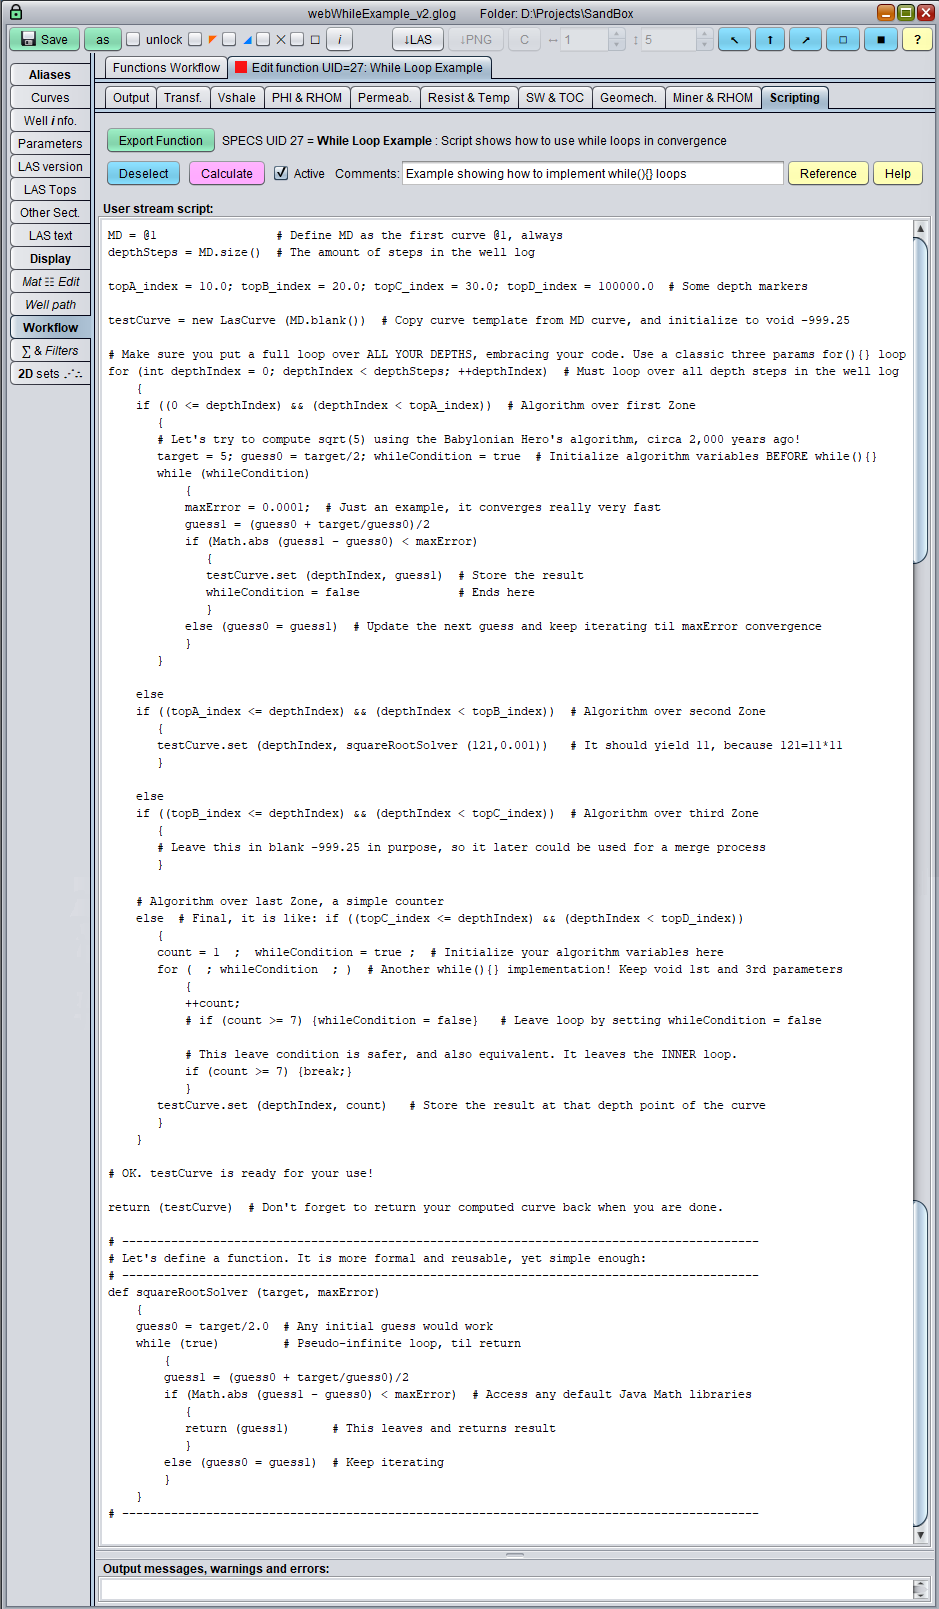
GeolOil GLS Petrophysics script example showing how to use while(){} loops
A dry run of the above script for square roots produces the values √(5)=2.236068, √(121)=11, and count=7.0 on a new curve for the well log. Its ASCII cells depth display looks like:
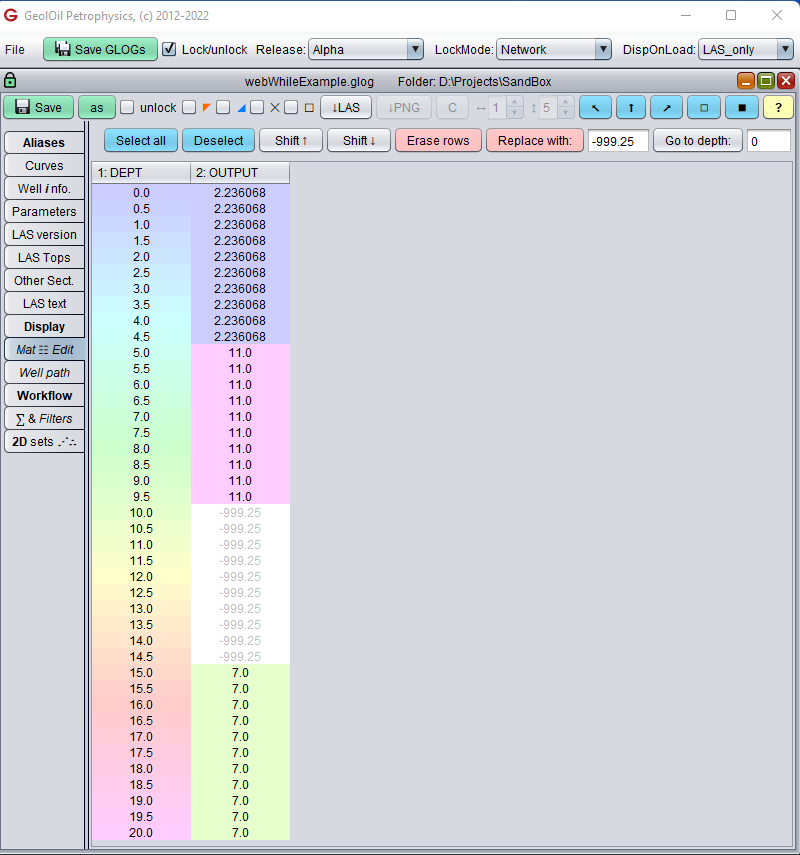
ASCII cells output of the curve computed with the square root script
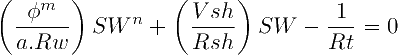
Instead of finding the square root of a number for educative programming purposes, a similar code can be written to numerically
solve the 1969 modified Simandoux SWeffective water saturation equation when
n is a real positive (not integer) ≠ 2 value:
The GeolOil Work-Flow module does that internally, asking data through GUI boxes input. However, you may want or need to write variants of the algorithm for full control and customizations.
4. Sample and hold curve extremes: Visual identification of spikes and wrapping a curve in a bandwidth envelope filter.
This script recipe allows to identify caliper corrosion depth intervals:
An engineering approach could be to handle the safety for the worst
case scenario, which is to pay attention to the maximum caliper extension due to corrosion.
The basic idea is to pinpoint a curve extreme, and instead of overlook or ignore it, make it noticeable both for visualization,
computation and interpolations.
The well log plot below, shows a thin but large caliper spike around the depth of MD=3806'. In this particular example, it may be has been caused by a wash-out or a similar effect that also seemed to cause an artifact of high porosity. The red MaxCaliper curve on the first track highlights and surrounds completely in an envelope, the black caliper curve together with its minimum green MinCaliper curve within a movable bandwidth:
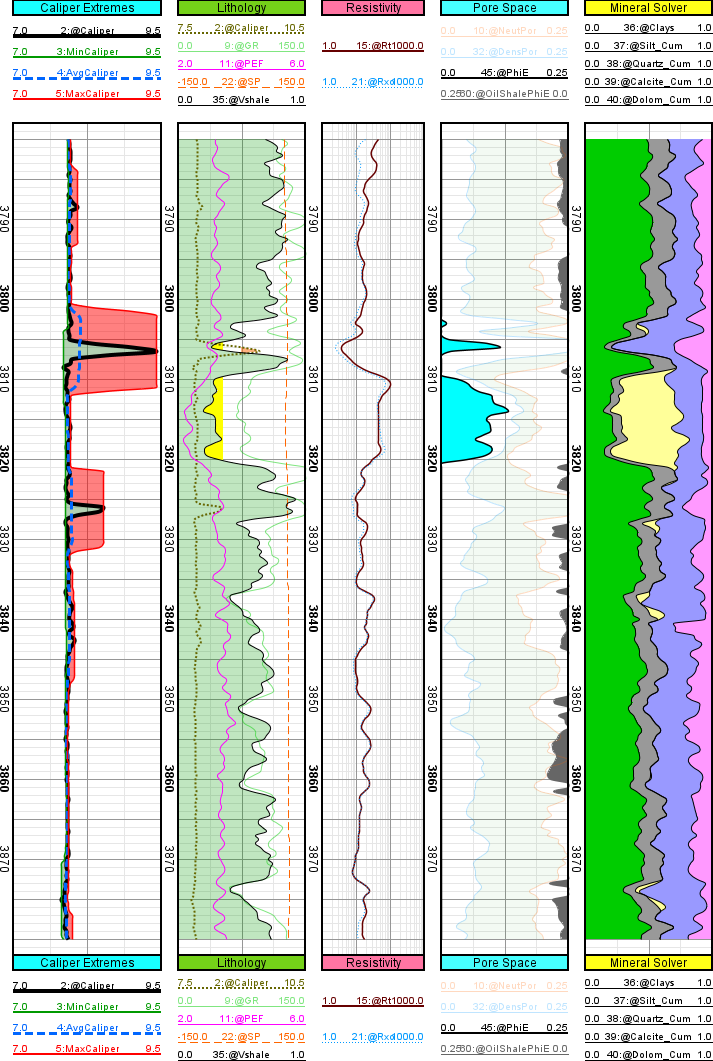
A well log plot showing a severe caliper wash-out around the depth MD=3806' (the black curve on the first track).
The GeolOil Stream Mode scripting was ideal to solve this task (try to do that using the regular depth loop mode instead). Just make a bandwidth of caliper curves by shifting them upwards and downwards, and then output the maximum envelope curve. A very easy to read, minimalistic fail-safe code:
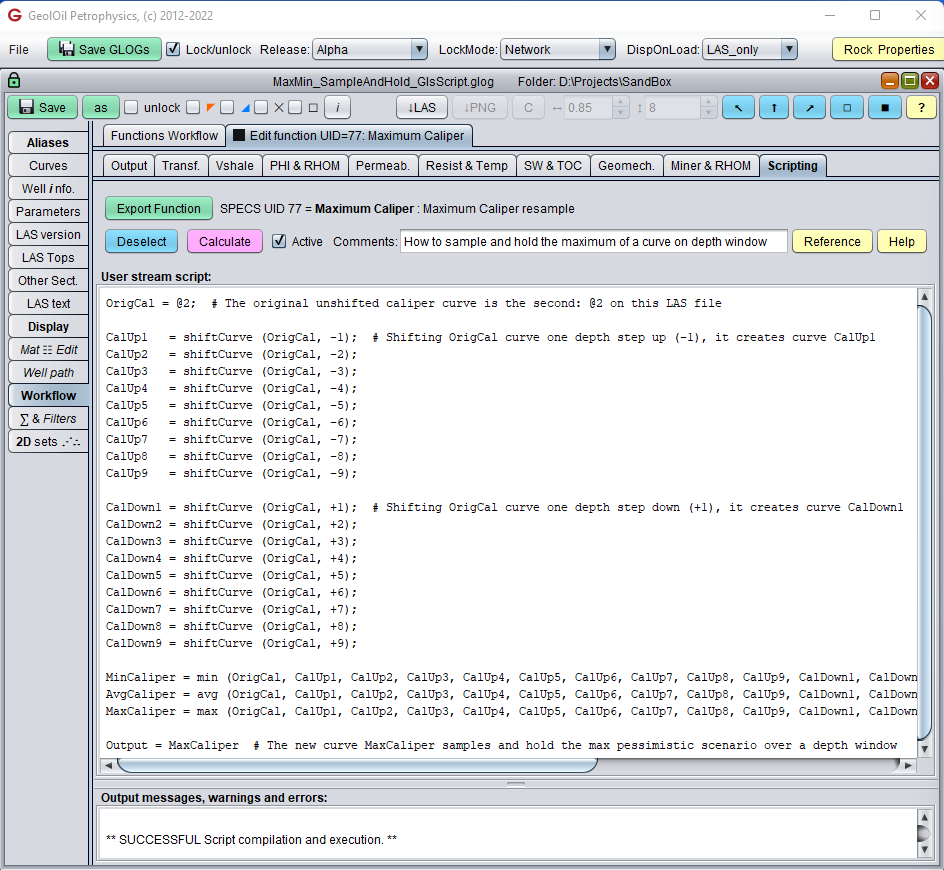
The minimalistic Stream Mode petrophysics script to wrap the caliper curve within a bandwidth. Notice that no for(){} loops are necessary in the Stream Mode.
5. GeolOil Syntax to define 3D arrays:
Multi-dimensional arrays are easy to define in GLS. Just declare then and process out of the box.
The recipe script below, shows how to declare 3D cell model arrays using the Depth Loop Mode.
While the example is synthetic, it serves to introduce the proper syntax, and the use of the command continue in loops.
The script shows a minimal code to detect if a cell count on a 3D mesh loop, is a prime number or not.
Just an educative syntax exercise:
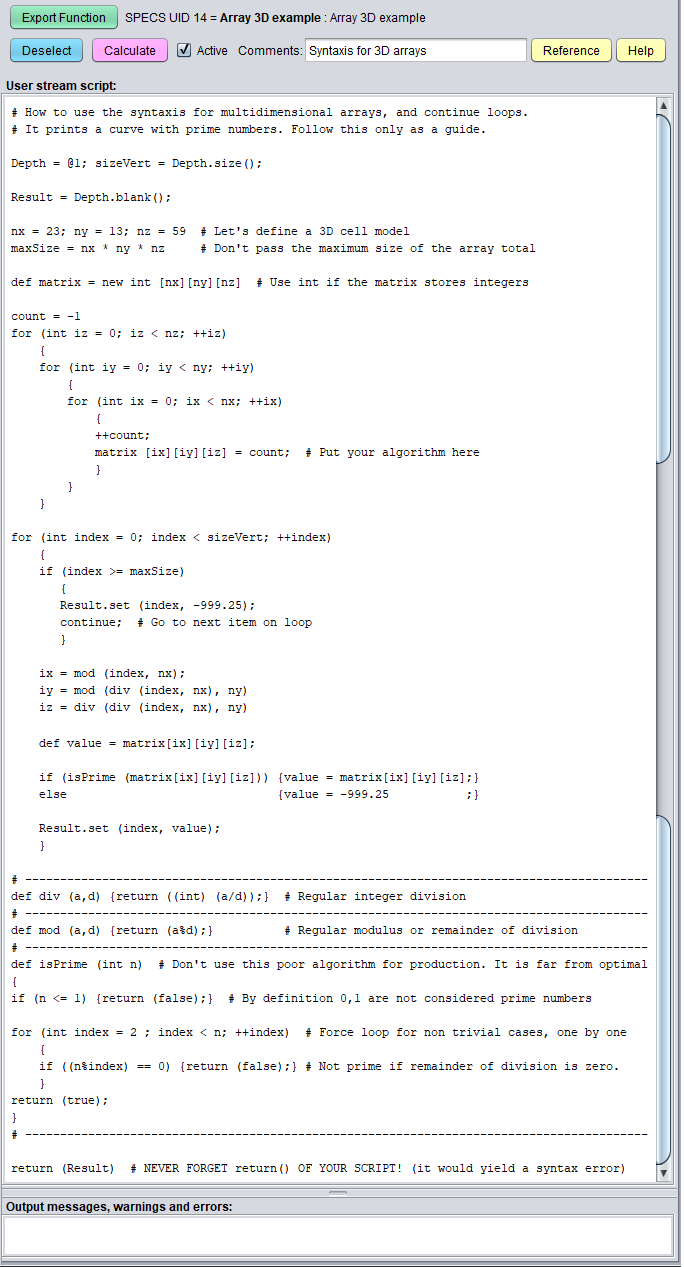
A Petrophysics script showing the GeolOil GLS syntax to define 3D arrays and loop over it
After run, the script creates a curve that shows in a table Excel style output, which cell counts are prime numbers:
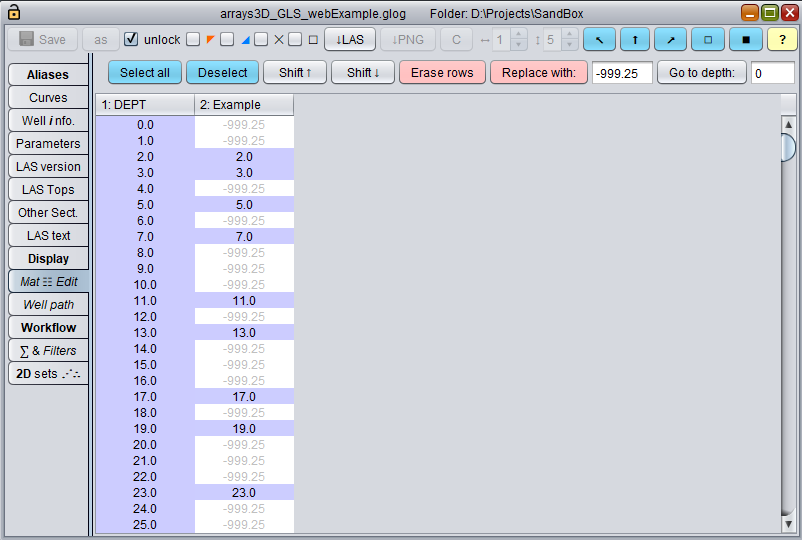
Table cell curve output showing which cell counts are prime numbers

|
Related article:
|
|
| |


|
|
|
© 2012-2026 GeolOil LLC. Please link or refer us under Creative Commons License CC-by-ND |