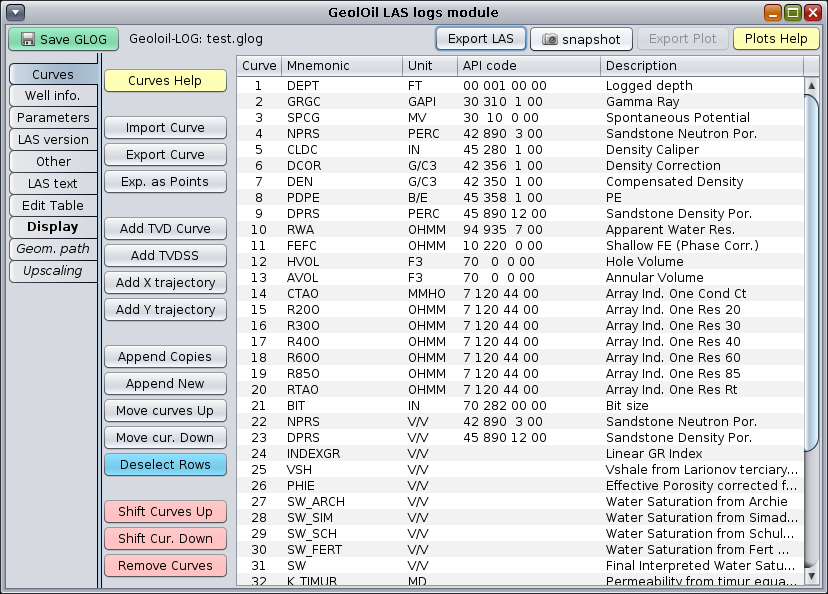
Our GeolOil LAS log file editor is an essential, must have tool for companies handling, preparing, cleaning, editing, and merging LAS file well logs. It allows to create new LAS files, merge several files into a single LAS, re-sample curves depth step resolution, change mnemonic names and fields.
With the LAS file editor you can:
- Edit curve mnemonics, well section, parameter section
- Add new log curves
- Remove curves
- Shift curves and core data
- Import curves from ASCII or text source data
- Edit curve values
- Add or remove depths
- Re-sample log and change its depth step resolution
- Merge two or more LAS files into a new LAS file
- Import deviation or directional survey file for non vertical wells
- Compute well path trajectory TVD, DX, DY from MD, Inclination, and Azimuth
- Back-engineer computation of Inclination and Azimuth from MD, TVD, DX, and DY
- Visualize well surface satellite location on a Google-Map window
- Normalize exporting of cleaned LAS files, and in some cases, auto-repair bad formatted LAS files
The figure below shows the Curves Section panel editor.
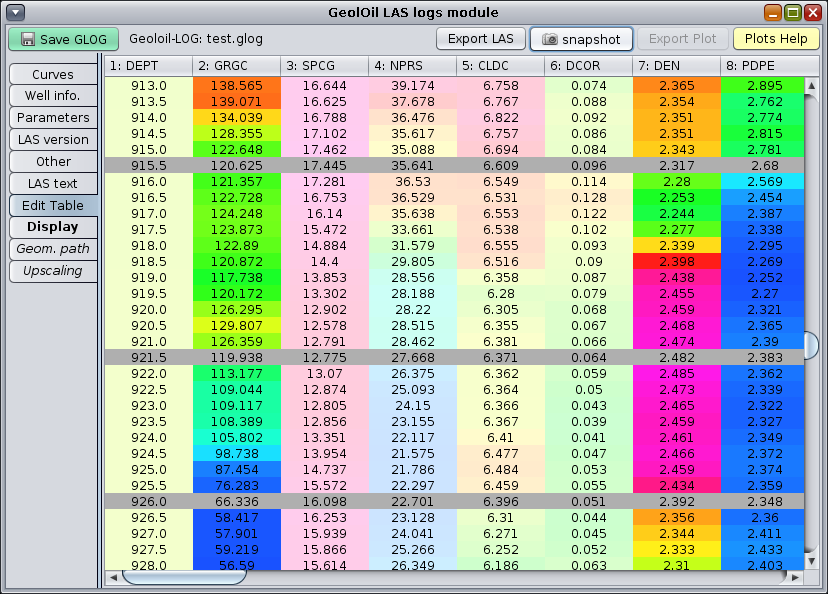
Get an immediate GeolOil's exclusive tabular view display and edit any well log data values with our non linear adaptive contrasty colors technology tabular display view. Identify trends and curve magnitudes easily.
The figure below shows the GeolOil exclusive adaptive colors table viewer
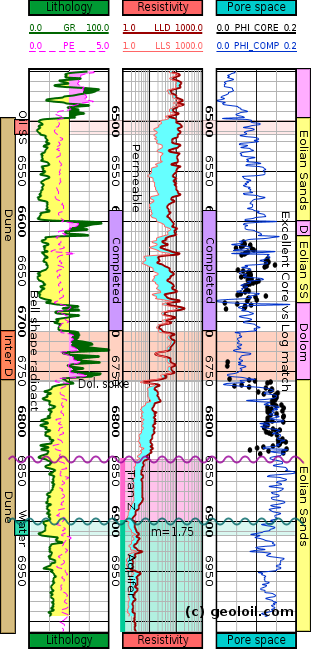
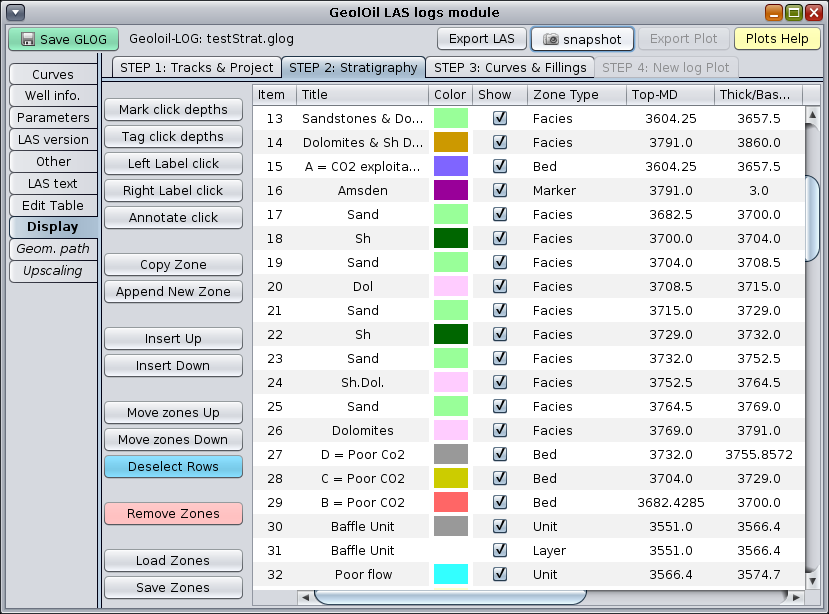
GeolOil stratigraphy panel allows to define and color shade stratigraphic and sedimentary data like formations, members, beds, markers, facies, flow units, and vertical layering layout easily. Completed well intervals can be also defined.
The figure below shows the GeolOil stratigraphy panel
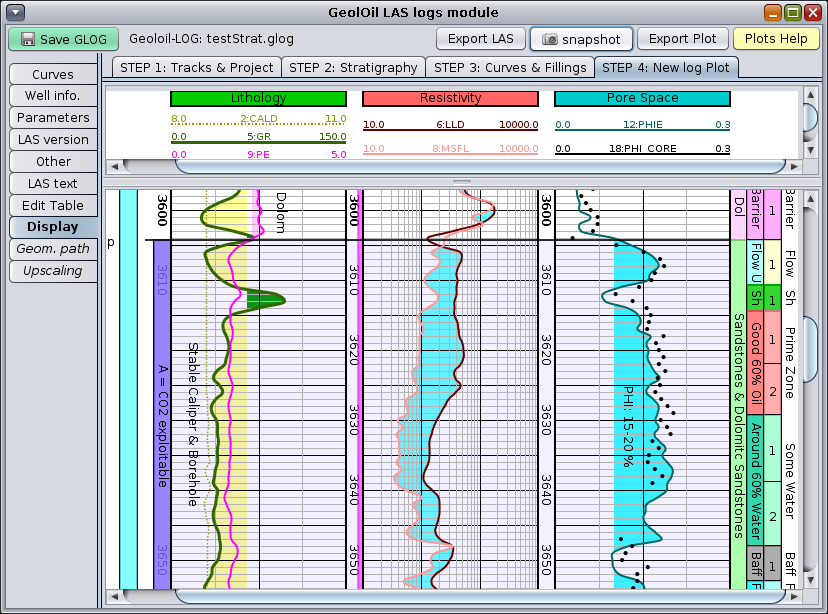
Once you define what tracks you want, select the curves that goes into them, to get a pristine quality display plot. You can apply threshold fillings to highlight sand beds, shale bodies, pay zones, and curve crossings like neutron and density porosity to identify gas pockets.
The figure below shows a log plot with stratigraphy and core data.

|
Related articles:
|

|
Related video: |